Detection/Classification metrics
Problem Statement
- Once we've trained multiple detection/classification models, how to choose the best model ?
- Once we've chosen the best model, how to choose the optimum operating point (the best threshold) ?
Solution
There are two metrics which can help us here. If you've come across terms like AP, mAP and F-1 score in research papers,
these are precisely the metrics that help us with the above mentioned problems. Let's begin by defining precision and recall,
which are pre-requisities to understanding other metrics.
Precision and Recall
Let's assume that we've trained a car detector.
💡
Precision is the ratio of true positives to total number of predictions.For every N predictions made by this detector on an image,this metric tells us what percentage of those detections are actually cars.
$$ Precision = \frac{TP}{TP+FP} $$
💡
Recall is the ratio of correct predictions to the number of ground truthlabels available for the class. Assuming that we have X cars in an image,this metric tells us what percentage of those X cars were detected correctly.
Average Precision (AP)
💡
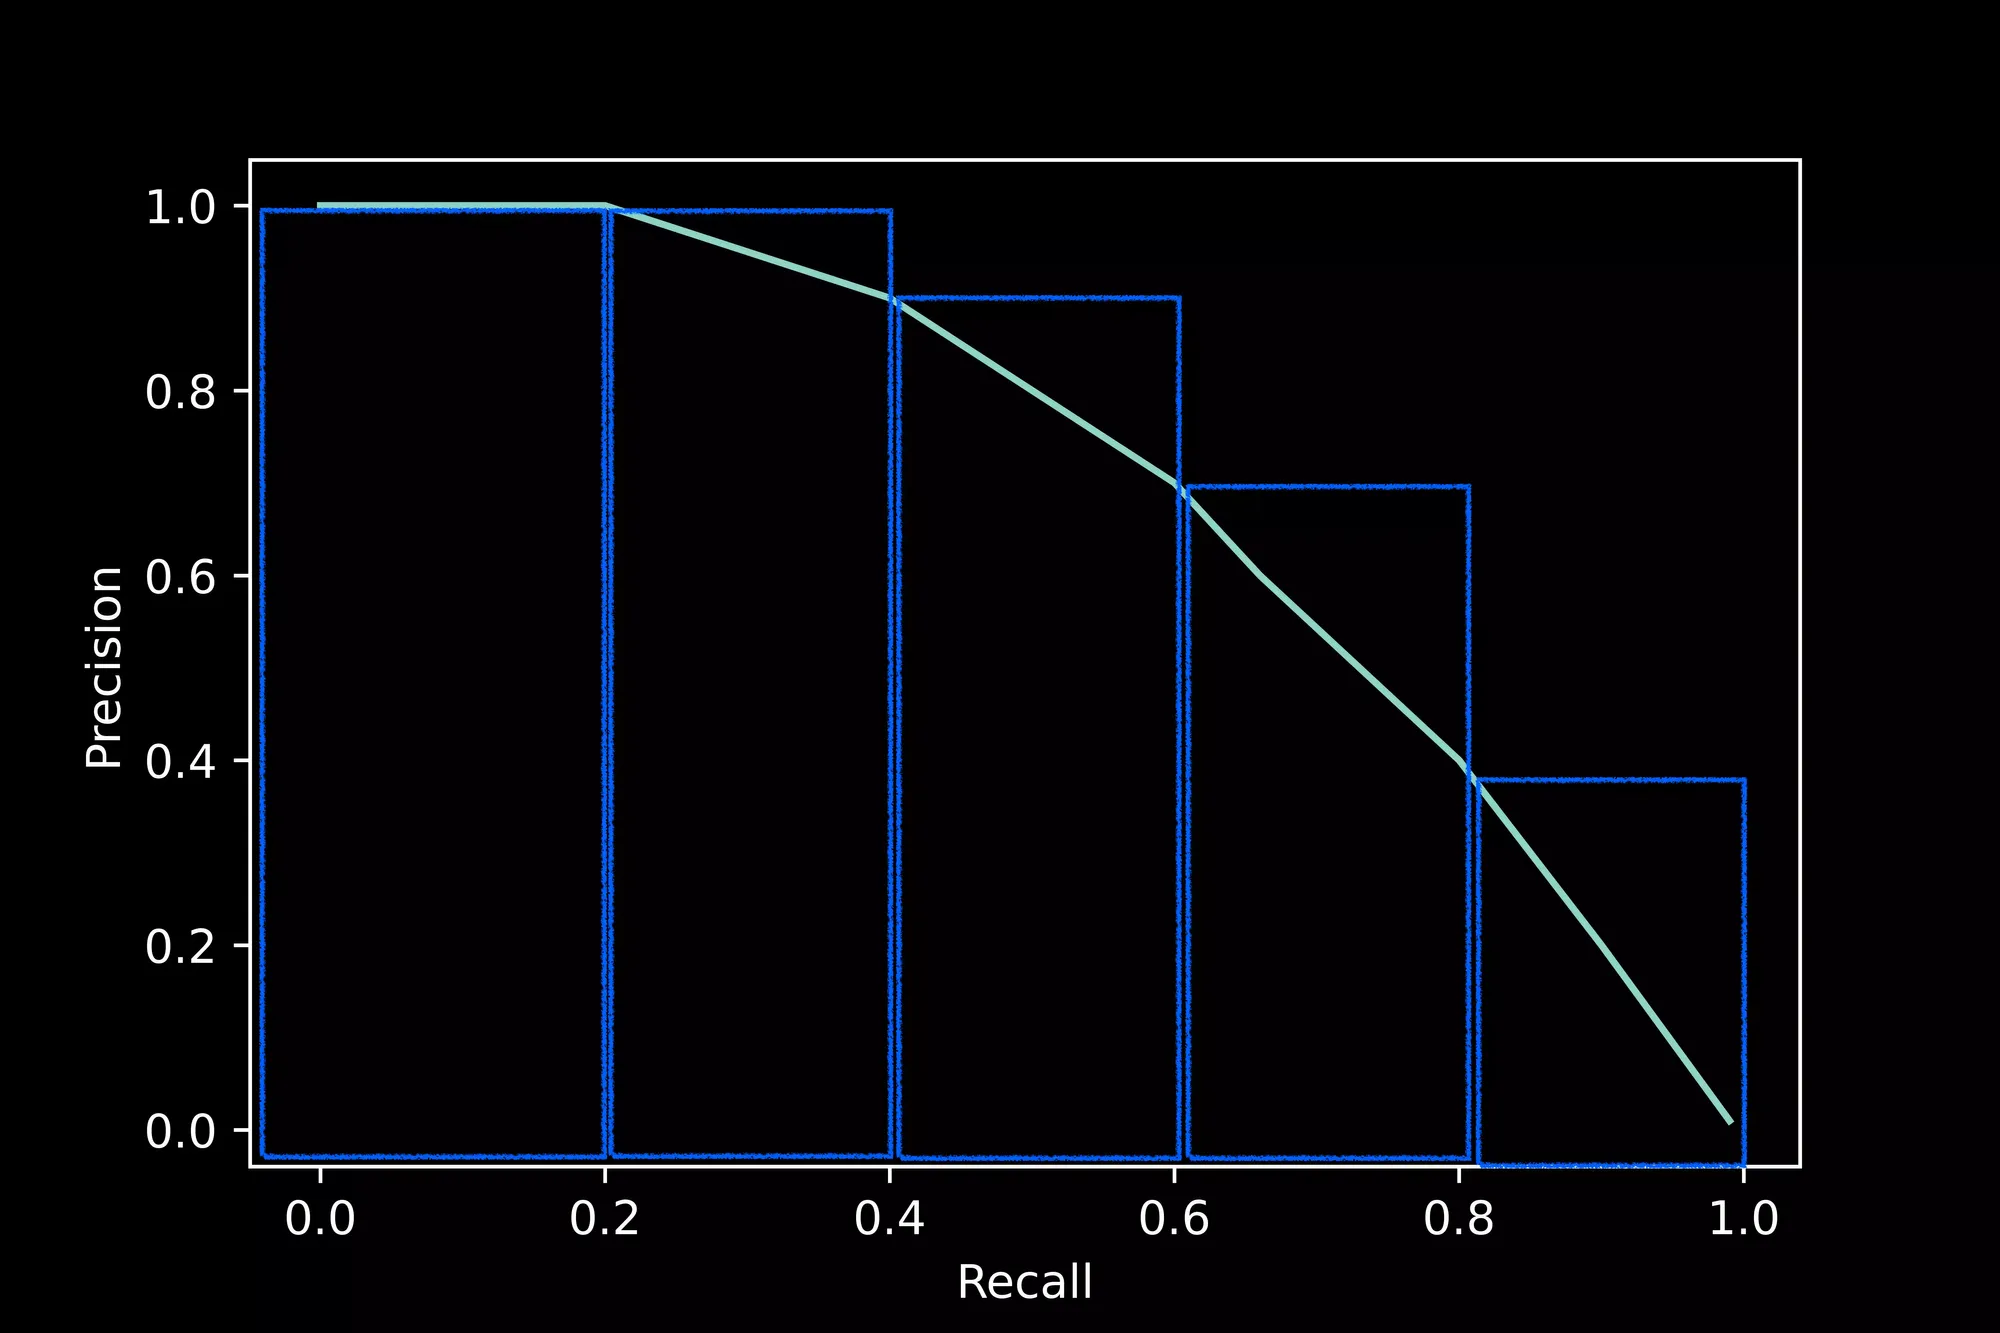
Average Precision is the area under the Precision - Recall curve.
$$ AP = \int_0^1 P(r) ,dr$$

We can use the standard sklearn package to compute the AUC (area under the curve),
or we can approximate the area, as shown in the figure above.
Mean Average Precision (mAP) is the mean of AP for all classes.
$$ mAP=\sum_0^N\frac{AP(i)}{N} $$
💡
Given N different models, the optimal model choice in *most* situationsis the one with the highest mAP
F1 score
💡
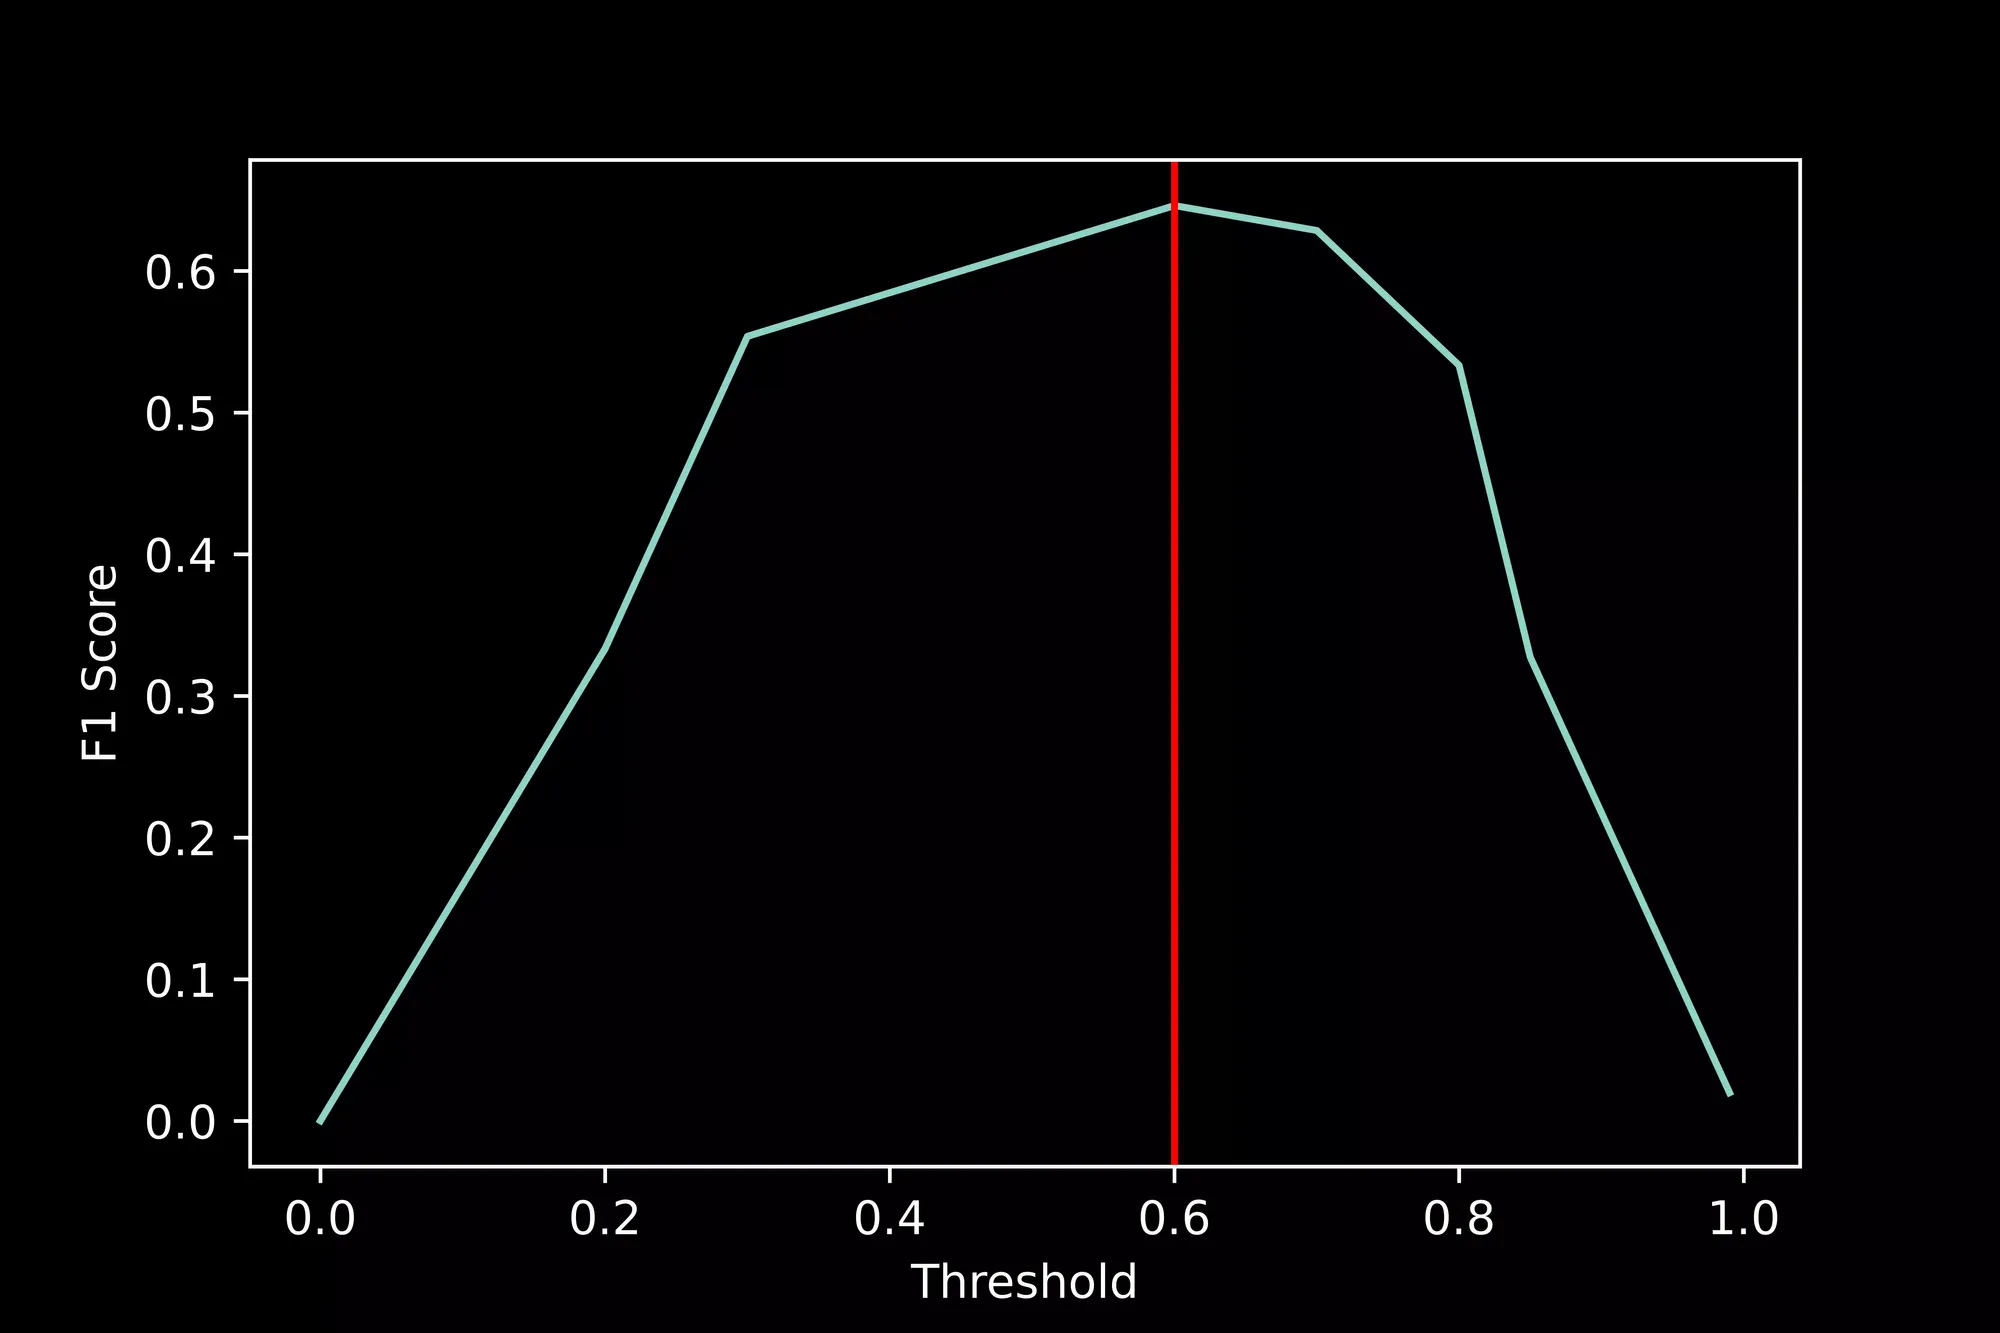
F1 score is described as the harmonic mean of precision and recall.If we were to calculate the F1 score for every point on the PR curve,the point with the highest F1 score is generally chosen as an operating point.

